Shiphay Learning Academy
School Data
SCHOOL RESULTS 2025
The information below compares the attainment of our pupils with local authority and national averages.
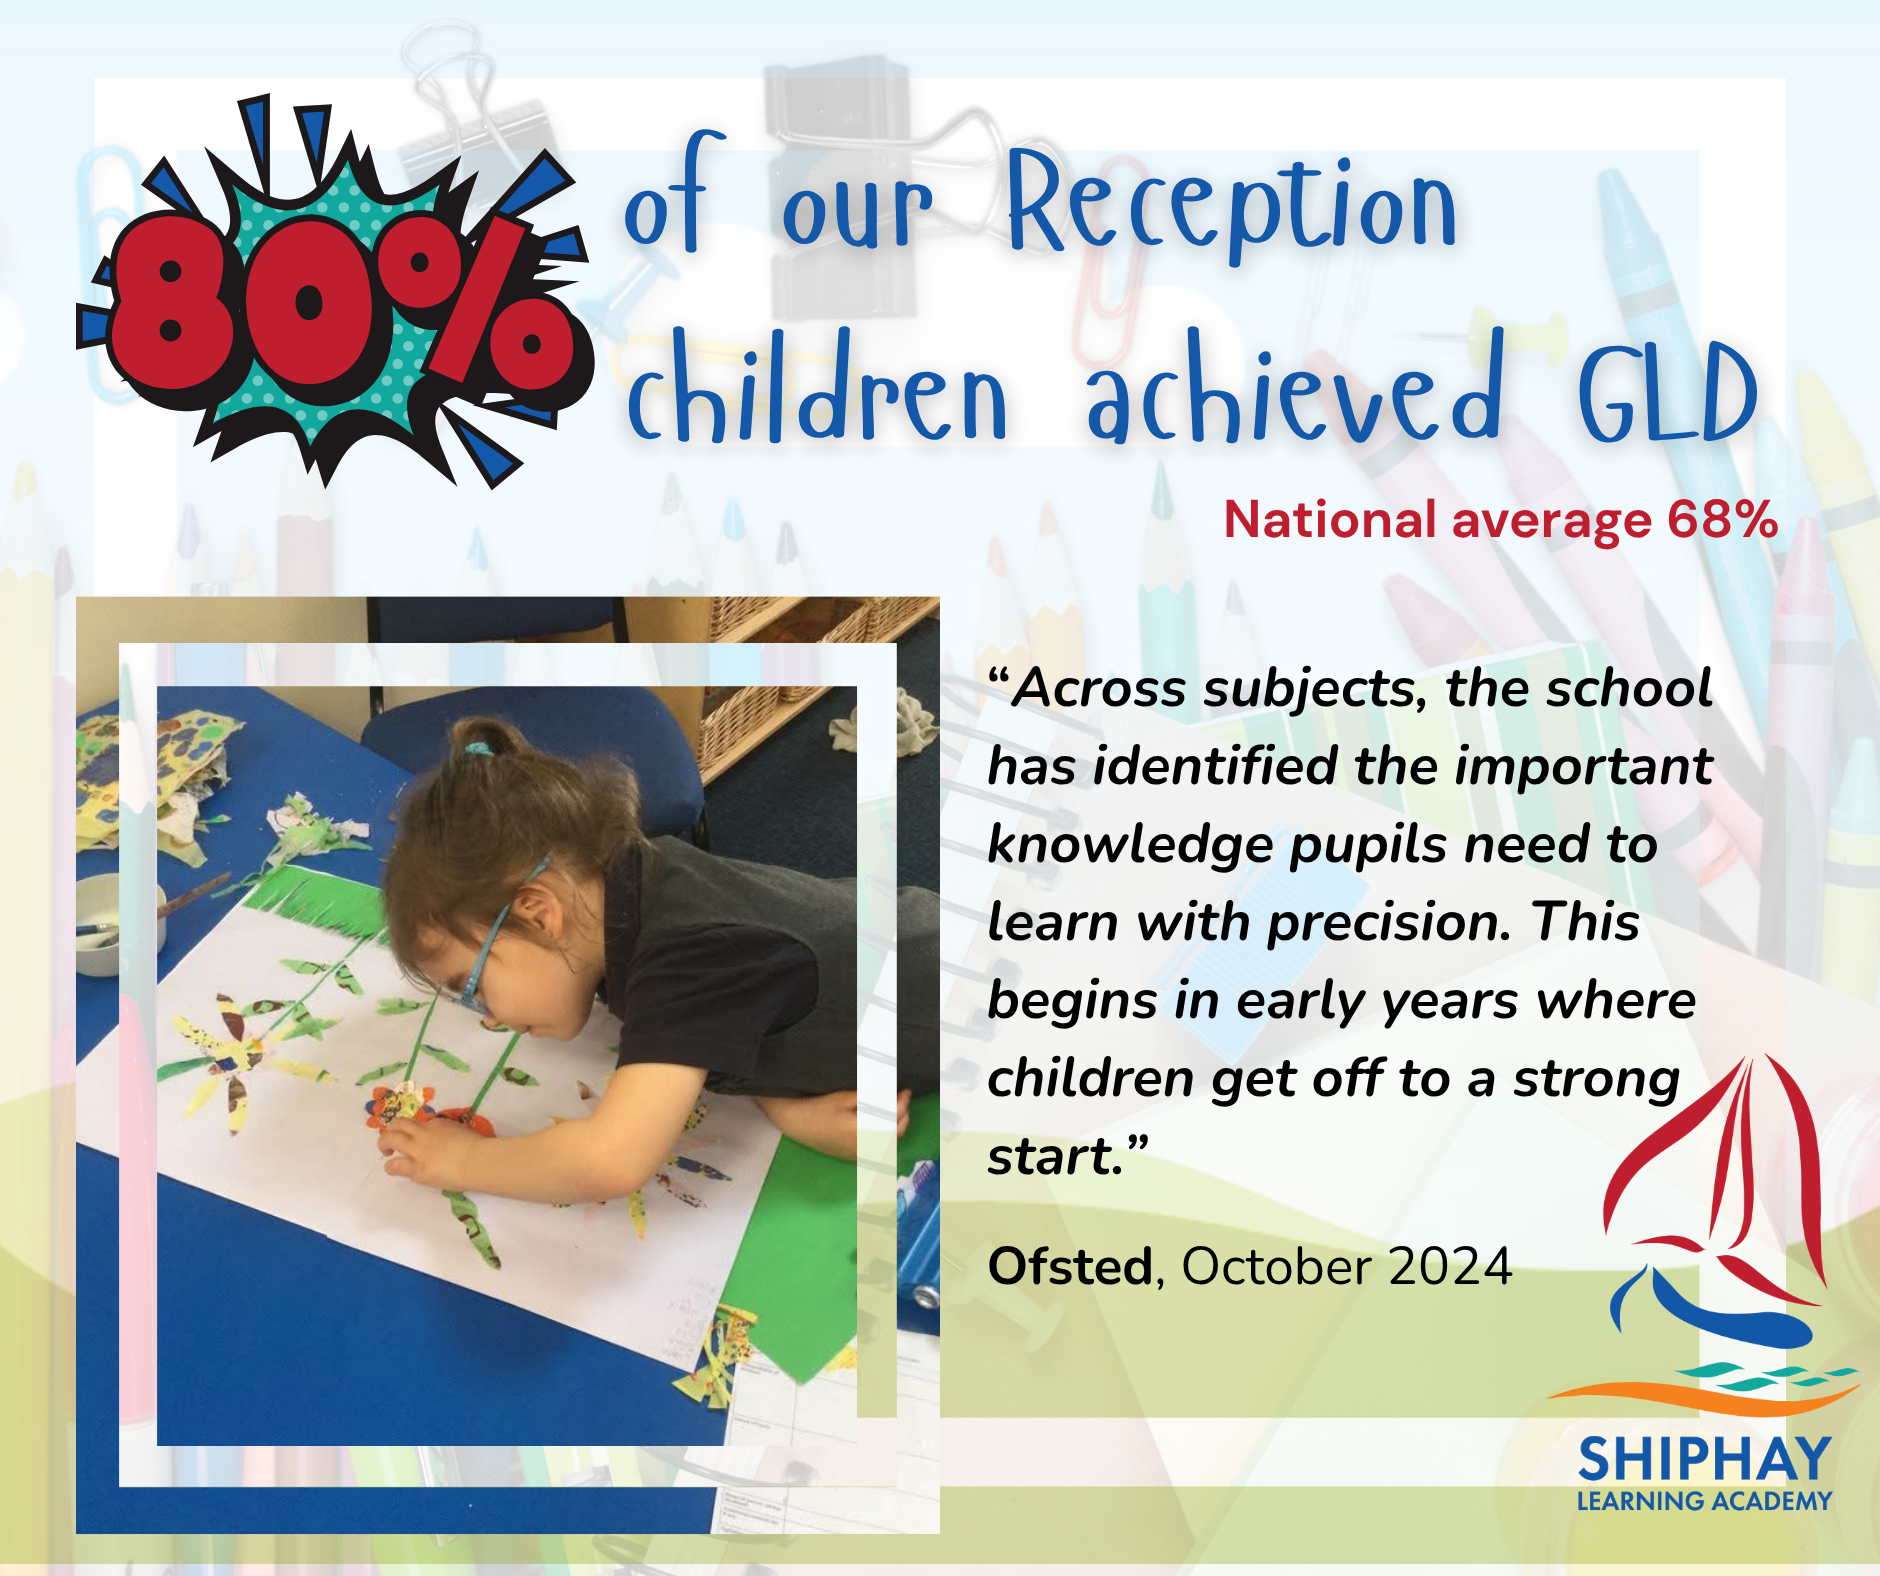
Year 1 phonics check
79% of children at Shiphay passed the phonics check. National was 80%.
Year 4 multiplication tables check
The average points score (out of 25) was 20. The national score was 21.1.
27% of children achieved top marks. National was 38%.
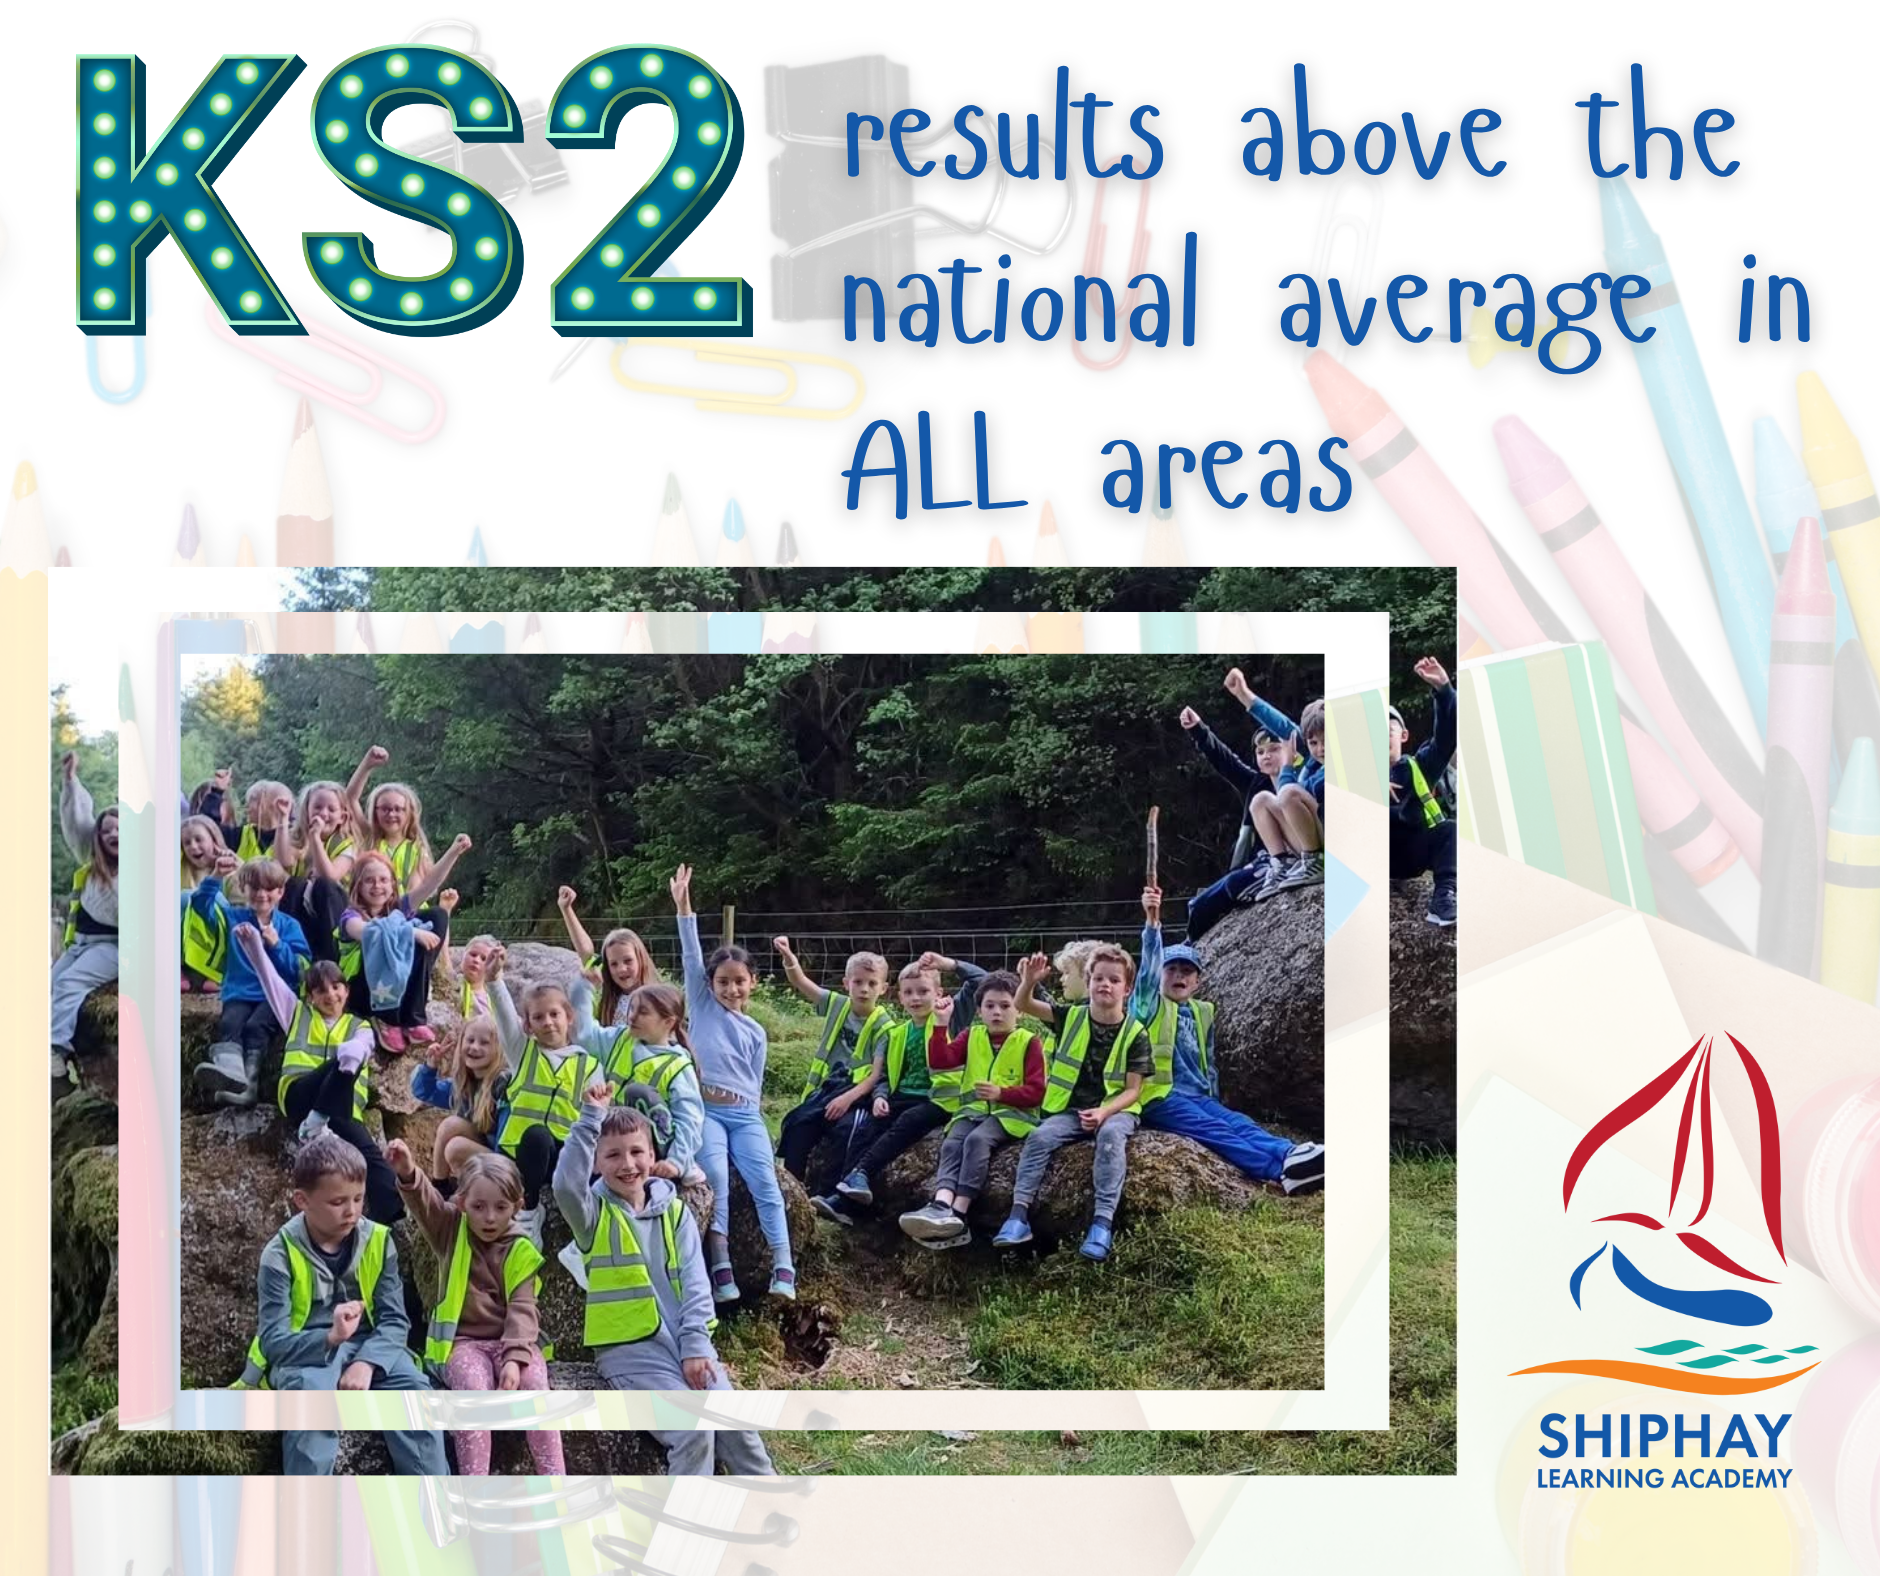
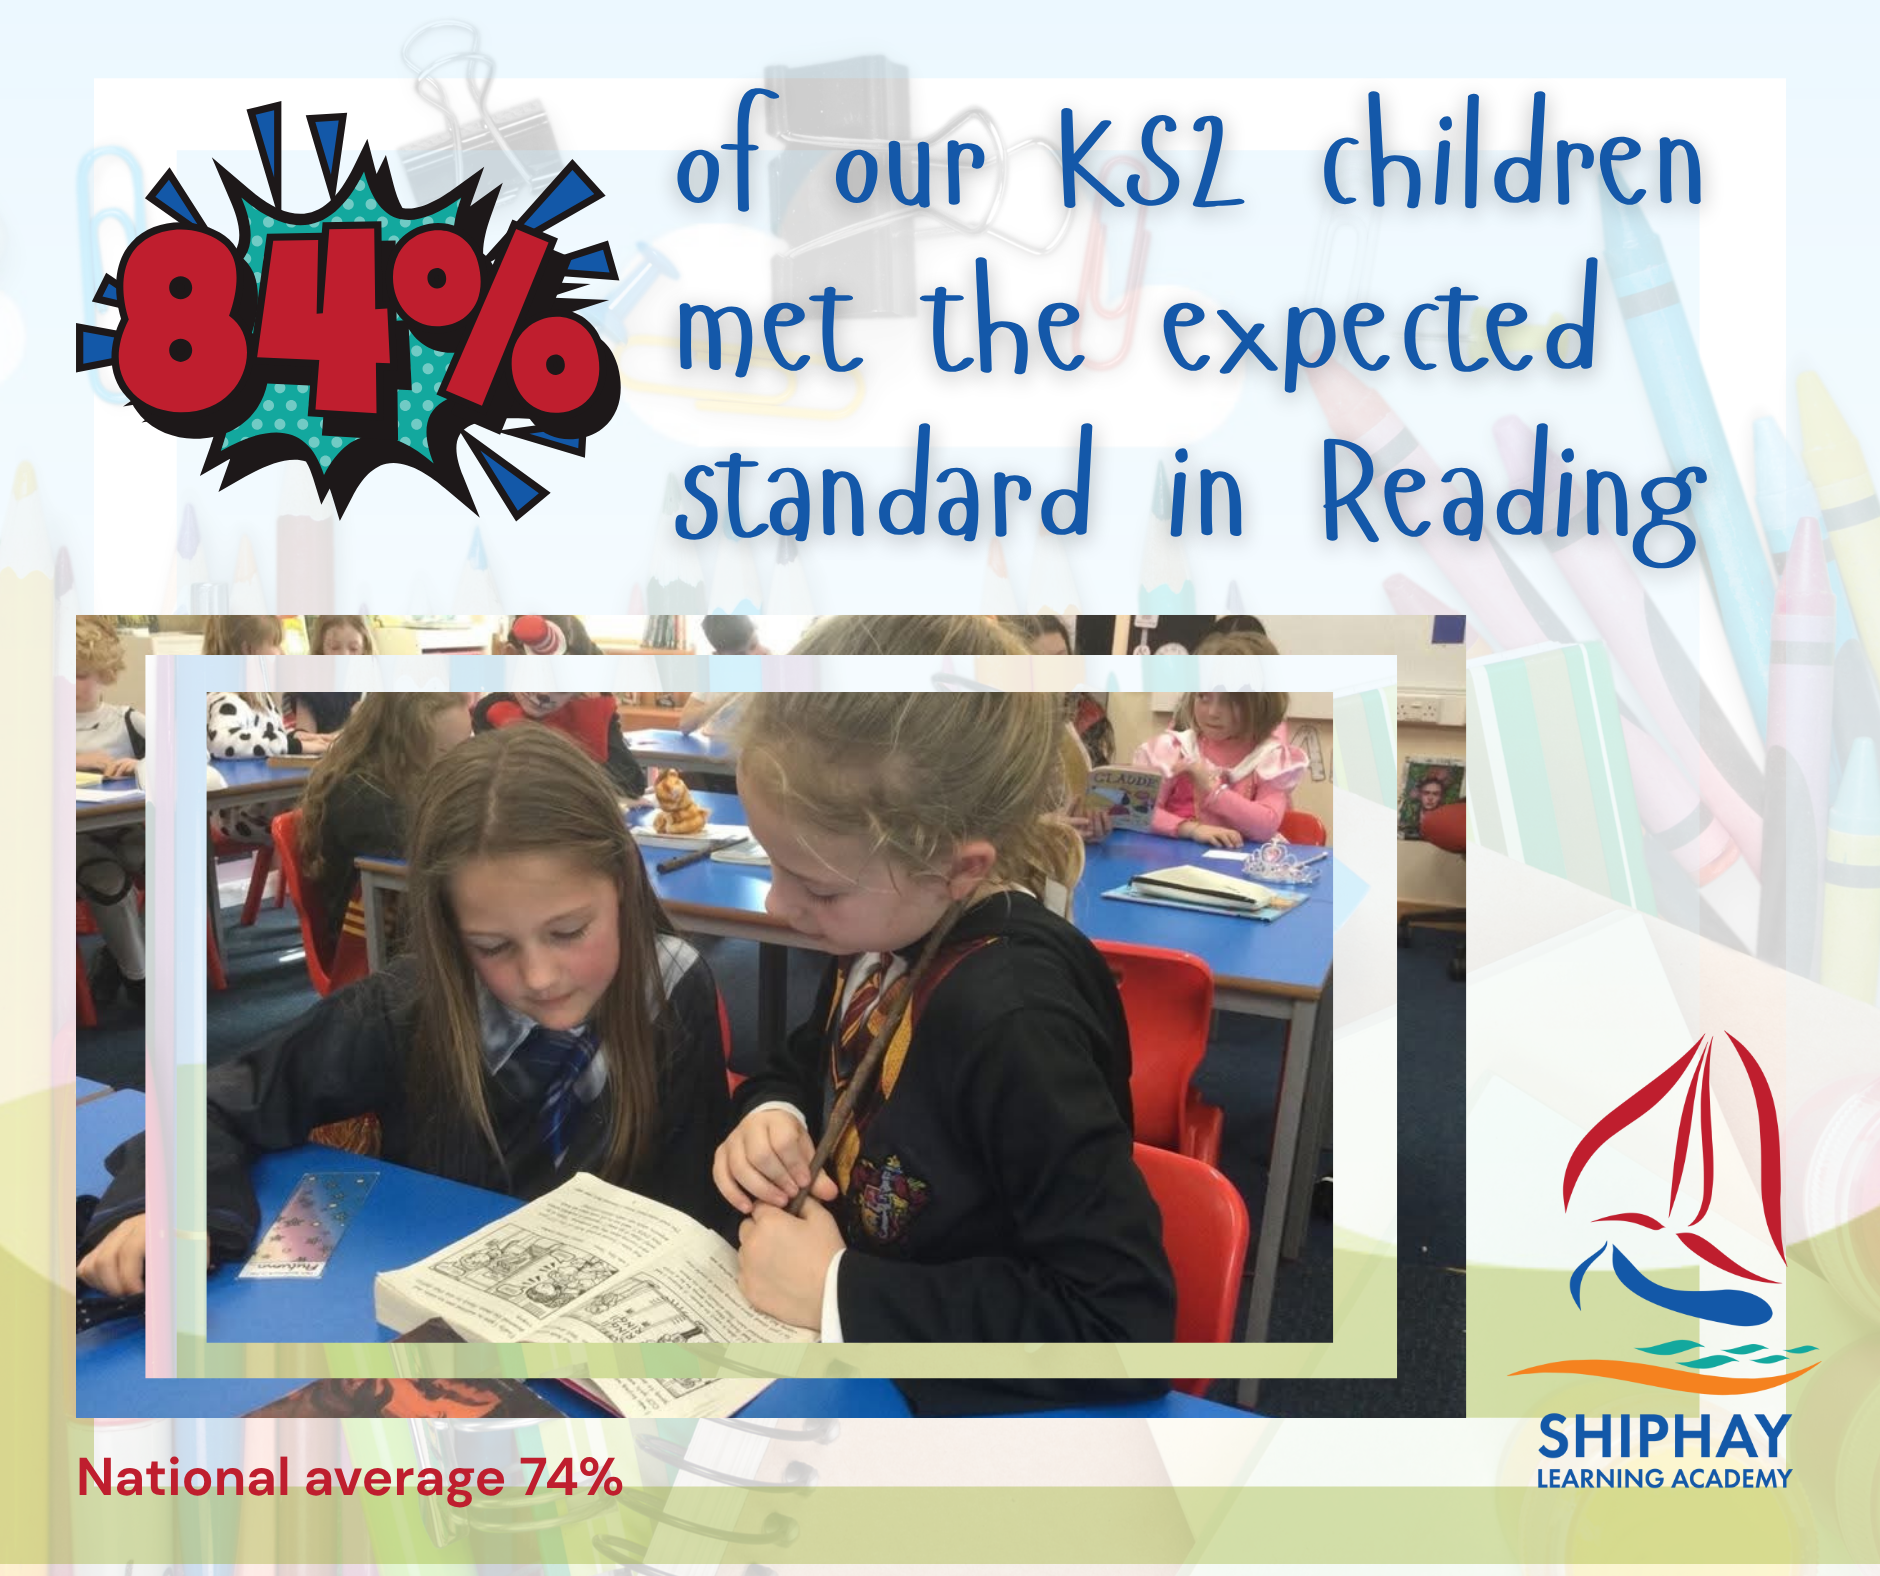
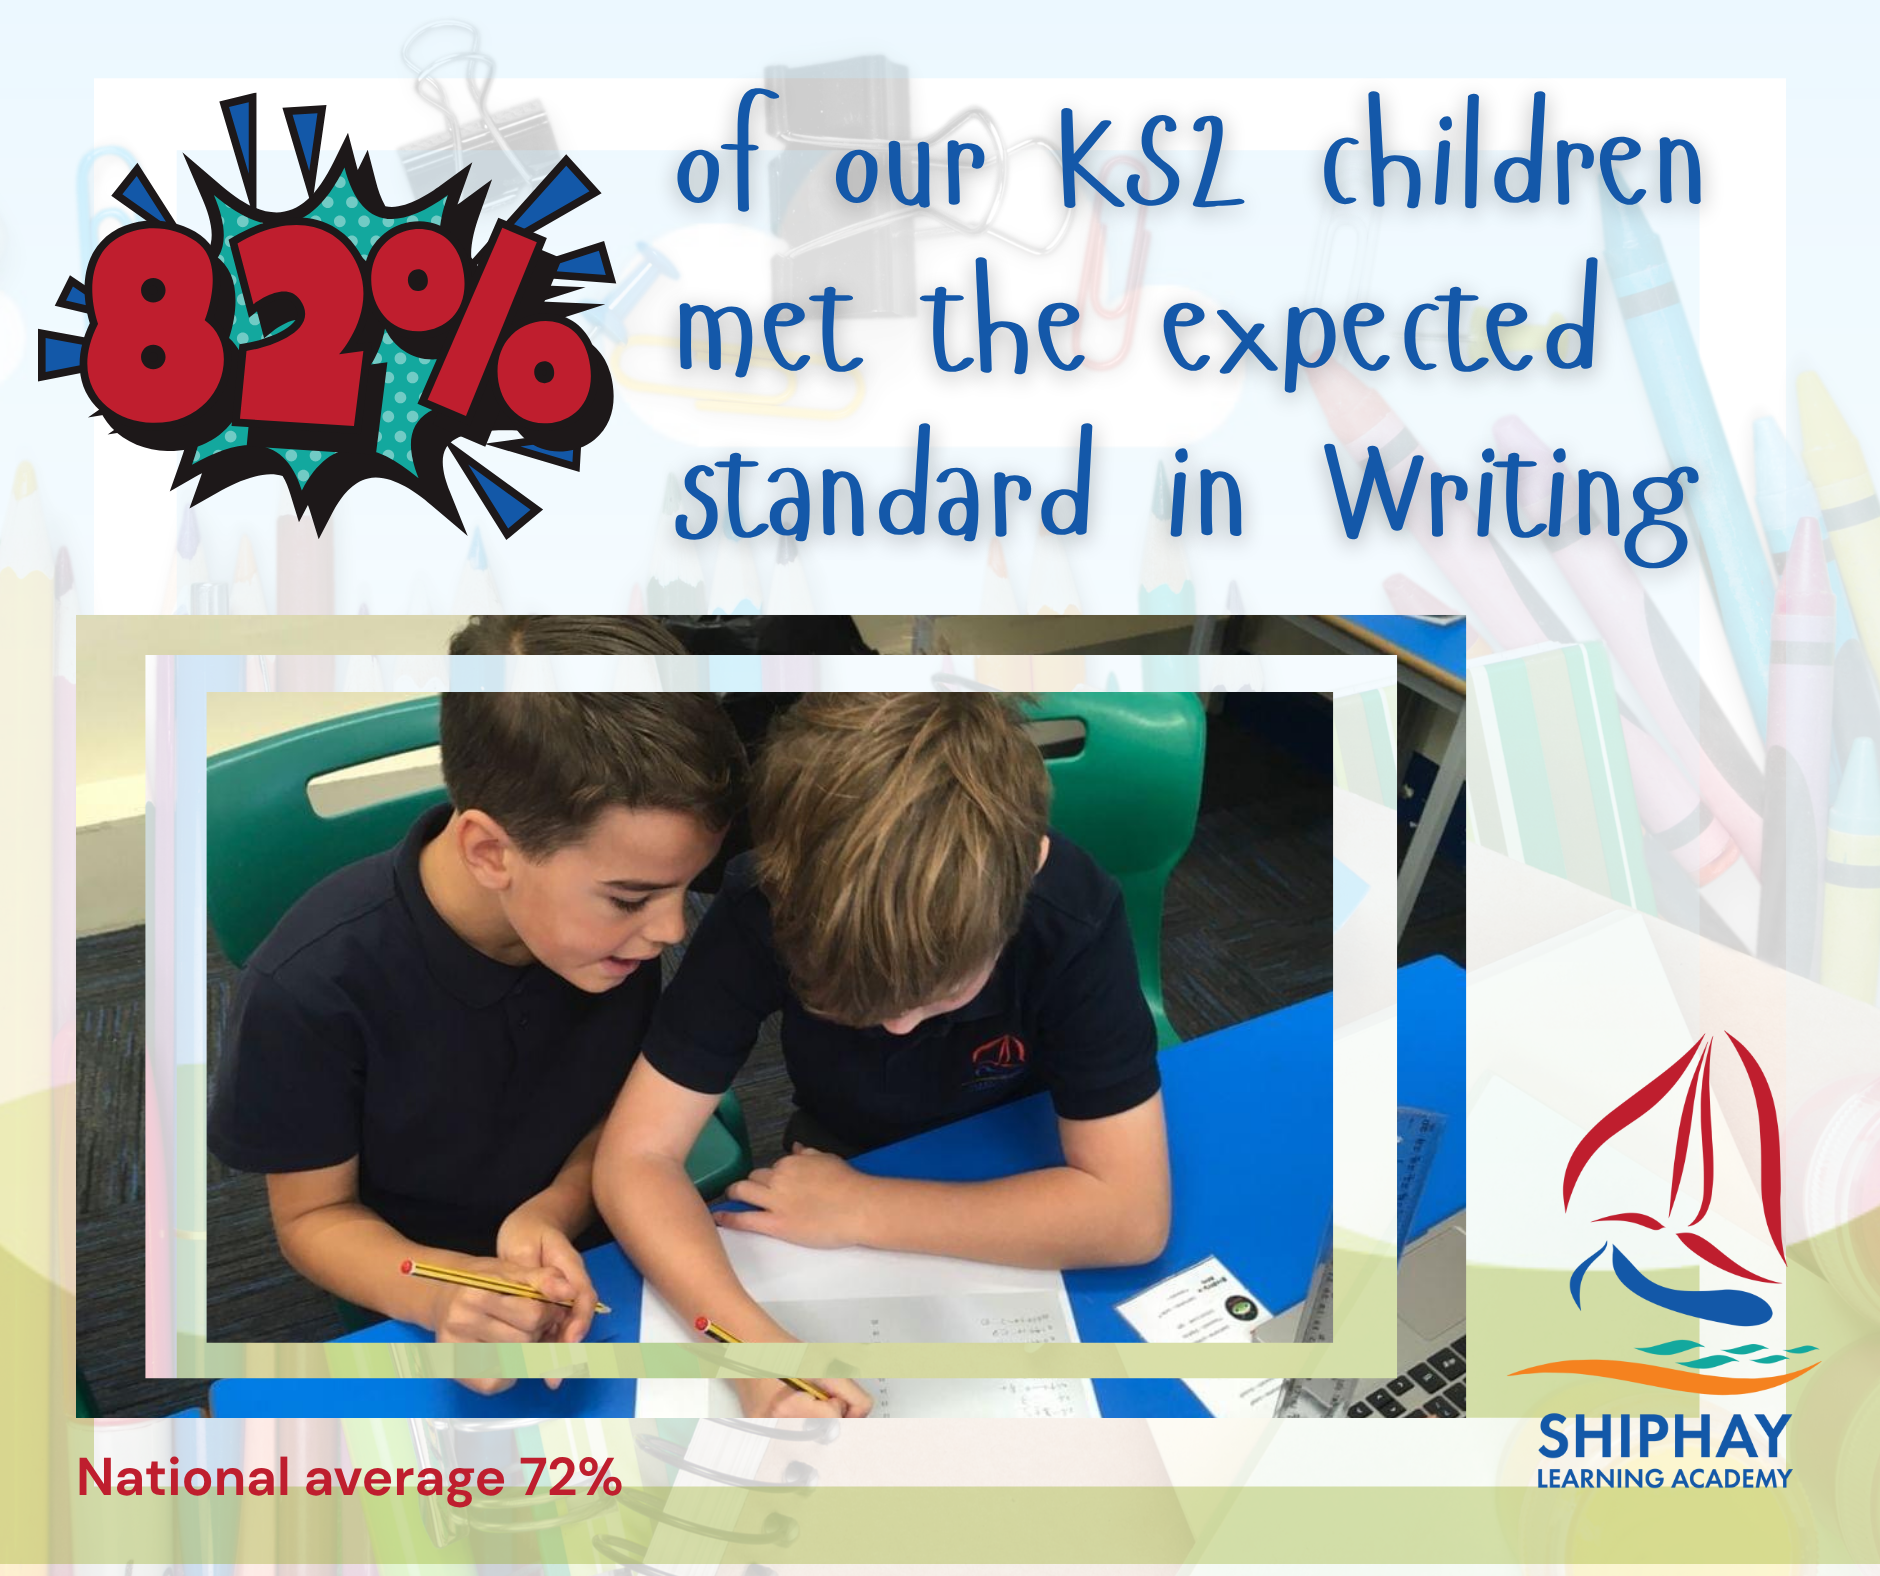
Year 6 (end of Key Stage Two)
Results of the SATs (tests) are reported using a scaled score, where a score of 100 represents the expected standard. The highest possible score is 120 and the lowest is 80. Year 6 pupils were assessed in reading, writing, grammar, punctuation and spelling, maths and science.
Children are awarded one of the following Teacher Assessment judgements in writing:
- Expected Standard – working at the expected standard for a child at the end of year 6
- Greater Depth – working at a greater depth within the expected standard, with a strong understanding of the curriculum
In addition to these measures and in line with requirements, school also reports the percentage of children achieving a High Standard. Children with a scaled score of 110 and above are included in this group.
| End of KS2 results 2025 | SHIPHAY | National average (2025) | Torbay Local Authority average (2025) |
|---|---|---|---|
|
Reading - Expected Standard |
84.0% |
75.0% |
74.9% |
|
Reading - Higher Standard |
34.0% |
33.0% |
31.7% |
|
Reading - Average Scaled Score |
106.7 |
106 |
105.5 |
|
Writing - Expected Standard |
82.0% |
72.0% |
66.3% |
|
Writing - Greater Depth |
15.0% |
13.0% |
10.9% |
|
Maths - Expected Standard |
76.0% |
74.0% |
73.4% |
|
Maths - Higher Standard |
23.0% |
26.0% |
22.6% |
|
Maths - Average Scaled Score |
103.9 |
105 |
104.5 |
|
Reading, Writing & Maths COMBINED - Expected Standard |
66.0% |
62.0% |
58.0% |
|
Reading, Writing & Maths COMBINED - Higher Standard |
6.0% |
8.0% |
7.7% |
Please click the button below to go to the Department for Education's school performance tables